
Expressions in Motion: Advanced Polars for the Data Engineer
Polars series #3 #edition23

What’s on the list today?
Polars Series, Part 3: Exploring Flight Delays through Expressions and Data Transformations
Data News: Databricks acquires Neon the serverless Postgres company.

🐻Polars Series – Part 3: Expressions & Transformations
Welcome back to the Polars journey! This is the 3rd part in the 5 part series of exploring Polars as a data frame library.
Part1 - An Introduction to Polars
Part2 - Lazy Execution in Polars
In previous edition(Part 2), we explored how Polars brings blazing-fast performance and efficient lazy evaluation to your data workflows. Now, it’s time to unlock the expression engine — the heart of Polars — and use it to build powerful transformations that scale cleanly.
As with previous installments of our series, we'll utilize the Flight Delays dataset to derive actionable and meaningful insights.
For those interested in following along, the repository is now available to explore further Github-Polarexpress
💡What Are Polars Expressions?
In Polars expression is a lazy representation of a transformation. Instead of acting immediately expressions are declarative in nature and describe what to do rather than how to do it and allowing Polars engine to figure how to efficiently handle the transformation.
import polars as pl

heavy_delay = pl.col("dep_delay")>60
print(heavy_delay)
The code expresses a simple transformation that selects a column named dep_delay and applies a boolean condition (dep_delay > 60). As this expression is merely a declarative representation of the transformation, no computations occur yet, and it can be safely printed for inspection.
Context
Since expressions are abstract, they require a context to be executed, yielding a result. The most typical contexts for expressions are select and with_columns.
For illustration, we can associate our heavy_delay expression with either a select or a with_columns operation to obtain a tangible result.
import polars as pl

df_flights = pl.scan_parquet("data/flights.parquet")

#expression
heavy_delay = pl.col("dep_delay") > 60
print(heavy_delay)

df_flights = df_flights.select(
    "carrier", "flight", "dep_delay", "origin", "dest"
).with_columns(heavy_delay=heavy_delay)

print(df_flights.collect())
The key difference between
with_columnsandselectis that the former creates a new DataFrame by adding or modifying existing columns, while the latter simply selects a subset of columns selected by its input expression.
Composable Expressions
Expressions are composable — which means you can DRY (Don’t Repeat Yourself) your logic. In the code below we can compose an expression that calculates the avg delay, maximum delay and total delay by carrier by making use of reusable composable expressions.
dep_delay = pl.col("dep_delay")

df_summary = df.group_by("carrier").agg([
    dep_delay.mean().alias("avg_dep_delay"),
    dep_delay.max().alias("max_dep_delay"),
    dep_delay.sum().alias("total_delay_minutes")
])
This approach is clean, testable, and flexible — ideal for pipelines that grow in complexity.
Transformations
Now that we understand the concept of composable expressions, the transformations in Polars becomes very intuitive. In the composable expression above we already saw an advanced type of transformation called grouped aggregations lets look at a few other examples that solve common known data engineering problems.
📊 Pivot: Delays by Destination Across Months
Why it’s useful: Quick transformation from long → wide format for comparisons or heatmaps.
df_flights = pl.read_parquet("data/flights.parquet")

#pivot
df_pivot = (
    df_flights.group_by(["dest", "month"])
      .agg(pl.col("dep_delay").mean().alias("avg_delay"))
      .pivot(
          values="avg_delay",
          index="dest",
          columns="month"
      )
)
print(df_pivot)
Note: Pivot is not supported on lazy frames as it is a unique operation that breaks the lazy optimization model as the operation needs to know all unique values in advance and the computation cannot be deferred like in other operations.
📈Rolling Averages: Compute a 3-flight rolling average of departure delays (per carrier):
Why it’s useful: Smooth trends or noise reduction, common in time series and ops monitoring.
df = df_lazy.sort(["carrier", "day"])  # Ensure proper order

df = df.with_columns([
    pl.col("dep_delay")
      .rolling_mean(window_size=3)
      .over("carrier")
      .alias("rolling_avg_delay")
])

print(df.collect())
✈️ Windowing: Rank Flights by Departure Delay per Carrier
Why it’s useful: Window functions let you compute metrics across partitions of your data (e.g., by carrier, by day, by route), without collapsing it via aggregation.
df_with_rank = df_lazy.with_columns([
    pl.col("dep_delay")
      .rank("dense")
      .over("carrier")
      .alias("delay_rank_within_carrier")
])

print(df_with_rank.collect())🧠Lazy Execution Superpower
When working with large datasets, Polars’ lazy API lets you define transformations without executing immediately. The engine optimizes the full pipeline before running.
q = (
pl.scan_parquet("data/flights.parquet")
.filter(pl.col("dep_delay").is_not_null())
.with_columns([
(pl.col("origin") + "->" + pl.col("dest")).alias("route")
])
.group_by("route")
.agg([
pl.col("dep_delay").mean().alias("avg_dep_delay")
])
)
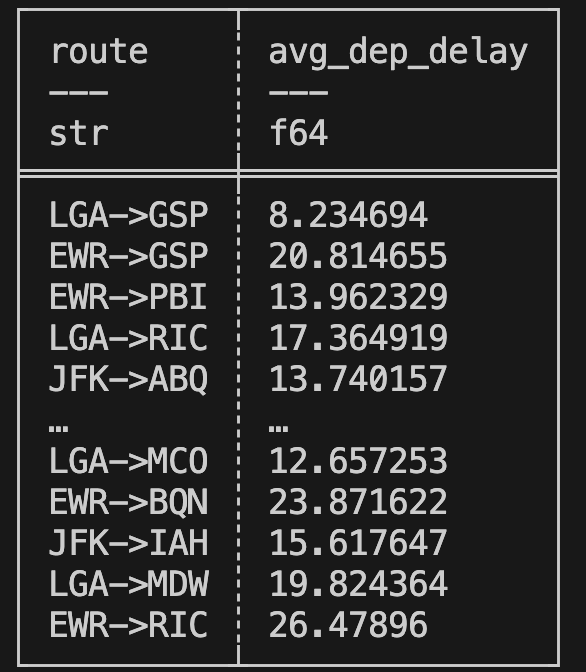
print(q.collect())For example, the pipeline above first filters out non-delayed flights, calculates a new route column, and then aggregates the average departure delay by route, resulting in a DataFrame that looks like this.
Expressions and transformations form the core of Data Engineering problems, and with Polars' powerful optimizer and custom DSL, writing and executing these pipelines is a breeze.
You can build an entire analytics pipeline using Polars alone — from file reading to transformation, to reporting — and it’ll be blazing fast with fewer lines of code than pandas or SQL 🚀.
Thanks for checking out part-3 of the series. Stay tuned for the next one. The example code is available on Github.
📰 Data News
Databricks has agreed to acquire Neon, a company that specializes in serverless Postgres solutions 💻.
Neon is a cloud-native Postgres company that offers a serverless PostgreSQL platform designed for modern applications and developers 💸.
Neon is well-known for its features, including:
A developer-first experience, which prioritizes the needs of developers 👩💻.
Instant branching for development, enabling seamless collaboration 🔄.
Built-in autoscaling and pause/resume capabilities, which provide flexibility and efficiency 💻.
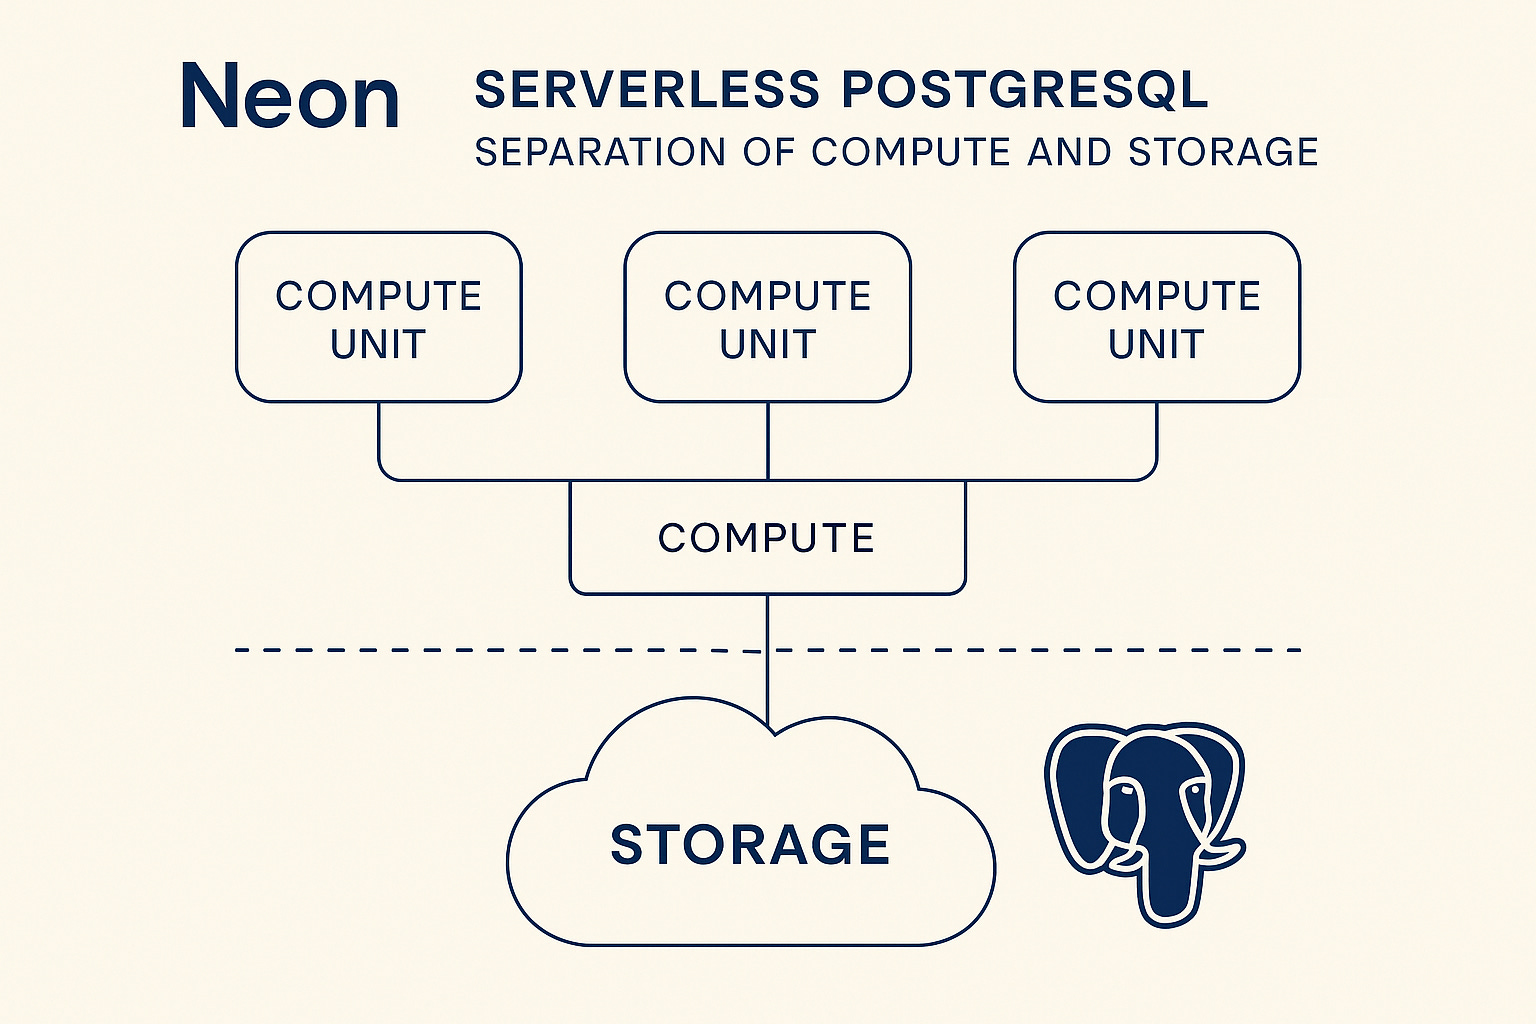
Databricks and Neon will collaborate to achieve separation of storage and compute, ultimately enabling scalable, efficient, and developer-friendly workflows with PostgreSQL 🔓